Dynamics 365 forecast accuracy: compare sales predictions with bookings

Dynamics 365 forecast accuracy analysis compares a prediction made at a defined cut-off with the actual outcome for the same period and measure. A current pipeline report cannot, by itself, show how the forecast looked before deals slipped, changed value or were lost.
An independent warehouse can retain forecast submissions and opportunity history, then connect them to confirmed orders. This gives sales operations and finance a common basis for reviewing both the result and the reasons for the variance.
Define the prediction before calculating its error
This use case concerns Dynamics 365 Sales opportunities and submitted forecasts, with actual order bookings from Finance, Supply Chain Management, Business Central or another agreed source. Demand planning in Supply Chain Management is a separate forecasting process with different measures and grain.
Dynamics 365 Sales supports forecast configurations and hierarchy-based rollups. Retain the selected configuration and approved adjustments alongside the underlying opportunities. Read Microsoft's forecast configuration guidance.
Microsoft deprecated the sales forecasting snapshot capability from 30 June 2024 and points to the Forecast API for daily synchronisation as an alternative. Plan an explicit capture process and validate the data it returns, rather than depend on the former snapshot feature. See Microsoft's removed or deprecated features.
Agree whether the measure is unweighted committed bookings, weighted opportunity value, invoiced sales or recognised revenue. Those measures have different timing and meaning. Comparing a bookings prediction with an accounting revenue total can create an artificial forecasting problem.
Preserve the horizon too: a submission one week before month-end should not be compared as if it had the same uncertainty as a submission three months earlier.
Real-world example: Sandvik Coromant improved customer data visibility
Microsoft's Sandvik Coromant story describes Dynamics 365 CRM and Copilot for Sales supporting customer information capture and better visibility for sales teams. Read the Sandvik Coromant story.
Reliable opportunity information is a useful input to forecasting. Evaluating predictions also needs a retained submission and a defined actual outcome. The following worked example illustrates that extra analytical step; it does not attribute a forecast score to Sandvik Coromant.
Worked scenario: £600,000 predicted, £420,000 booked
An illustrative team submits a manager-approved, unweighted forecast of September order bookings on 1 September. Values are before tax and in one reporting currency.
| Deal | Submitted September forecast | September bookings | Explanation |
|---|---|---|---|
| A | £250,000 | £225,000 | Won at a reduced value |
| B | £200,000 | £0 | Moved to October |
| C | £100,000 | £100,000 | Won as expected |
| D | £50,000 | £0 | Lost |
| E | £0 | £95,000 | Booked outside the original forecast |
| Total | £600,000 | £420,000 | Net shortfall of £180,000 |
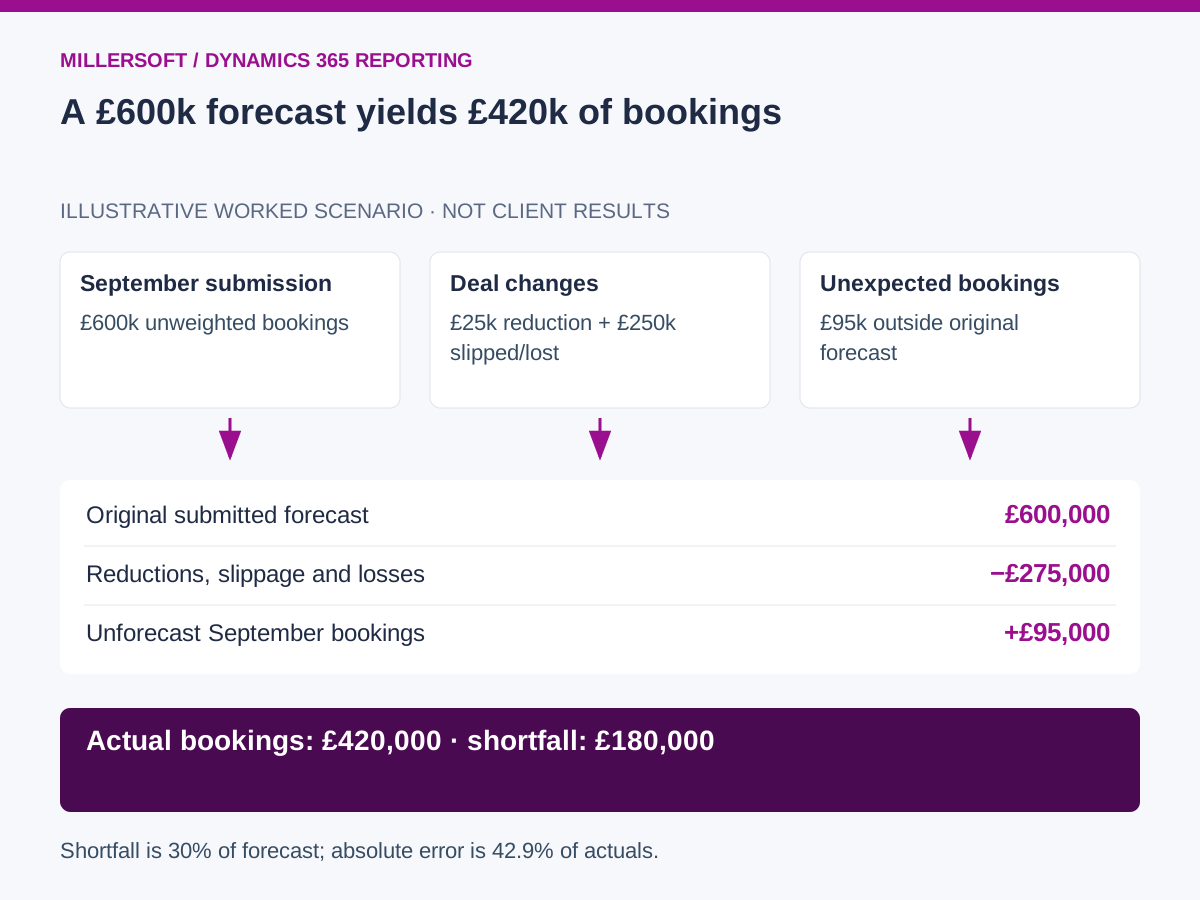
The bridge is £600,000 minus £25,000 of value reduction, £200,000 of slippage and £50,000 of losses, plus £95,000 of unforecast bookings. It ends at £420,000.
The shortfall is 30% of the submitted forecast. Absolute error divided by actual bookings is 42.9%. Label the formula and denominator rather than presenting either percentage as a universal “accuracy” score. When actual bookings are zero, the latter percentage is undefined; use an appropriate alternative such as absolute error.
 (opens the full-size image in a new tab)
Retain the original population and subsequent outcomes
Capture forecast issue date, reporting period, opportunity identity, customer account, source environment, salesperson, team, category, probability, value and expected close date. Keep overrides and manager approval separate from the current opportunity fields.
Retain opportunities that leave the original forecast population. Removing lost or slipped deals from the historical submission makes the prediction look better than it was. Identify newly created deals and those pulled forward from later periods separately.
Order relationships across Sales and the ERP also matter. A won opportunity is not automatically a confirmed ERP order or recognised accounting revenue. One opportunity may result in several orders, and later changes can affect the bookings definition. Reconcile the actuals to an agreed source report before attributing the movement.
Review forecast bias alongside total error
A surprise win can offset a major loss and produce a deceptively close total. Examine slippage, losses, value changes and unforecast bookings as well as the overall difference. Compare repeated submissions at consistent horizons to reveal patterns.
For probability-weighted forecasts, preserve the probability used at submission. Assess calibration across comparable opportunity groups rather than interpreting one lost deal as proof that its individual probability was wrong.
A first pilot can use one sales team and several completed months. Sales operations approves the forecast definition, finance confirms actual bookings, and both teams review the movement categories. Measure repeated overstatement or understatement and the completeness of captured submissions.
Retain forecast evidence for future analytics
Keeping submissions, mappings and outcomes independently makes the evaluation reusable after an ERP change. Historical training datasets can also use the information available at each prediction date, rather than accidentally include later deal outcomes as input features. This requires suitable capture and explicit point-in-time preparation.
Frequently asked questions
Does the current opportunity probability reproduce the old weighted forecast?
Only if it is the same probability that applied at the original cut-off. Retain earlier probabilities and submitted overrides when those are part of the forecast.
Does measuring error automatically improve forecasting?
No. It reveals patterns that teams can act on. Better close-date discipline, evidence-based categories and consistent review are operational changes, supported by the historical analysis.
Continue exploring Dynamics 365 reporting
Back to the independent Dynamics 365 data warehouse overview.
- Dynamics 365 historical reporting: reconstruct past business positions
- Dynamics 365 multi-company reporting across subsidiaries and ERPs
Make your Dynamics 365 reporting explainable
Talk to Millersoft about a focused Data Vault Engine & Studio pilot using your permitted source data, reporting definitions and retention requirements.
Discuss your Dynamics 365 reporting challengeMicrosoft and Dynamics 365 are trademarks of the Microsoft group of companies. Millersoft is not affiliated with or endorsed by Microsoft.