Odoo™ sales forecast accuracy: compare pipeline predictions with results

Odoo™ sales forecast accuracy measures how a prediction made at a defined time compares with the outcome for the same period and metric. Looking at today's pipeline cannot tell you whether the forecast submitted four weeks ago was realistic.
A warehouse can preserve opportunity values, stages, probabilities and expected close dates at each forecast cut-off, then link those predictions to later wins, losses and order bookings.
Why a current pipeline report cannot evaluate an old forecast
Sales teams update opportunities as conversations progress. A deal expected to close in September may move to October, change in value or be lost. If the earlier record state is overwritten, the original prediction can disappear from a retrospective review.
Odoo™'s documented Forecast report supports viewing upcoming opportunities and building a sales forecast. Historical accuracy analysis adds a separate requirement: preserve the forecast as it stood at the agreed submission time. See the Odoo™ 19 Forecast report documentation.
Define the outcome carefully. Won opportunity value, confirmed order bookings, invoiced revenue and cash receipts are different measures. A forecast of September bookings should be compared with September bookings before analysing downstream invoicing or collection.
Real-world example: Inspiralia's pipeline visibility
Odoo™'s Inspiralia success story describes centralising business data and using its sales application to view pipeline and current status. This illustrates the operational value of a connected sales process. Read Odoo™'s Inspiralia story.
The next analytical question is whether earlier expectations matched later results. The scenario below demonstrates that comparison; it does not claim Inspiralia achieved a particular accuracy score or used this warehouse design.
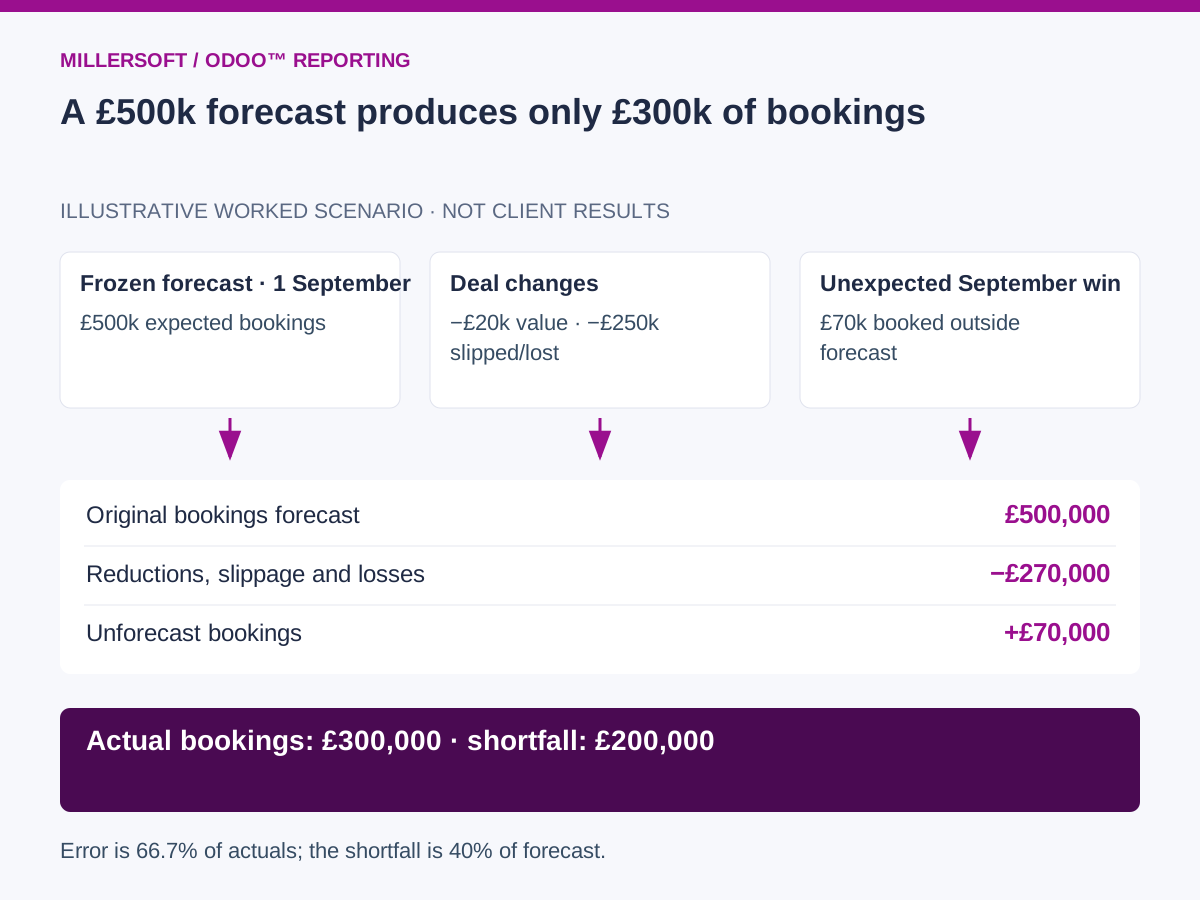
Worked scenario: a £500,000 forecast delivers £300,000 of bookings
An illustrative sales team freezes a £500,000 September bookings forecast on 1 September. The forecast is an unweighted, manager-approved list of expected deals, with values before tax in one reporting currency.
| Deal | Frozen September forecast | September bookings | Outcome |
|---|---|---|---|
| A | £200,000 | £180,000 | Won at a lower value |
| B | £150,000 | £0 | Slipped to October |
| C | £100,000 | £0 | Lost |
| D | £50,000 | £50,000 | Won as expected |
| E | £0 | £70,000 | Booked outside the original forecast |
| Total | £500,000 | £300,000 | Net shortfall of £200,000 |
The movement bridge is £500,000 minus £20,000 of value reduction, £150,000 of slippage and £100,000 of losses, plus £70,000 of unforecast bookings. It ends at £300,000.
Absolute error divided by actual bookings is £200,000 / £300,000 = 66.7%. The shortfall divided by the forecast is 40%. These are different measures and should not both be labelled simply “forecast accuracy”. When actual bookings are zero, the first percentage is undefined, so report the absolute error instead.
 (opens the full-size image in a new tab)
Preserve forecast versions and opportunity relationships
Capture stable opportunity identifiers, company, salesperson, team, stage, amount, currency, probability and expected close date. Keep the forecast issue date and any manager override separate from the live CRM fields.
Link opportunities to confirmed order lines where possible. One opportunity can produce several orders, and an order can be amended or cancelled later. Define how those relationships contribute to the bookings measure and preserve the source evidence.
Retain deals that leave the original forecast population. Otherwise the review can exclude lost or slipped opportunities and create an overly favourable picture. Also identify newly created deals and opportunities pulled forward from later periods.
Separate forecast bias from individual deal surprises
A total can look accurate because an unexpected win offsets a major loss. Review both the aggregate error and the underlying movement categories. Compare teams and periods using the same forecast horizon and measure.
If using probability-weighted forecasts, preserve the probability at submission. Evaluate calibration across groups of comparable opportunities rather than treating every individual loss as proof that its probability was wrong. Do not mix weighted pipeline value with an unweighted committed bookings forecast.
Start with one sales team and a monthly forecast. Agree the cut-off, capture the submitted population, reconcile actual bookings and review the bridge with sales operations. Track forecast bias over several periods, slippage rates and forecast completeness, rather than rewarding one unusually close monthly total.
Frequently asked questions
Should a lost deal be removed from the historical forecast?
Keep it in the original forecast population and record the later loss. Removing it would erase part of the evidence needed to evaluate the prediction.
Does historical reporting automatically make forecasts better?
No. It exposes patterns that teams can act on, such as optimistic close dates or repeated value reductions. Improvement still depends on process changes and consistent review.
Continue exploring Odoo™ reporting
Back to the Odoo™ data warehouse overview.
- Odoo™ historical reporting: reconstruct past order books and pipeline
- Odoo™ multi-company reporting: consolidate across entities and systems
Make your Odoo™ reporting explainable
Talk to Millersoft about a focused Data Vault Engine & Studio pilot using your Odoo™ data, reporting definitions and control requirements.
Discuss your Odoo™ reporting challengeOdoo™ is a trademark of Odoo™ S.A. Millersoft is not affiliated with Odoo™ S.A.