Yardi™ ESG reporting: connect energy, emissions and property data

Real estate ESG reporting depends on matching environmental measurements to the right buildings, reporting periods and boundaries. Yardi™ may hold property identities and operational information, while energy bills, meter readings, emissions factors and floor-area measurements sit elsewhere.
A warehouse can connect those datasets without treating every apparent performance change as a physical improvement. Reliable comparisons require both the measurement and its context.
Why a lower energy number may tell the wrong story
A portfolio's total consumption can fall because a building was sold or a meter stopped reporting. Energy intensity can fall because the recorded floor area increased. Emissions can change when a factor is updated even if consumption remains constant.
Landlord and tenant boundaries matter too. An invoice for a shared supply may cover spaces that are excluded from the denominator. A data model should identify the building, meter, coverage period, unit, responsibility boundary and evidence quality before aggregating the readings.
Real-world example: reporting boundaries and assurance
British Land's 2025 sustainability Reporting Criteria set out reporting boundaries and methodologies, with separate sections for greenhouse gases and energy. The document also describes assumptions, exclusions and selected assurance coverage. See British Land's 2025 Reporting Criteria.
This example shows why an ESG reporting dataset needs more than a property ID and an emissions total. Its methodology and evidence need to travel with the figure. The warehouse approach below is an illustrative design, not a description of British Land's systems.
Worked scenario: an apparent 20% efficiency improvement
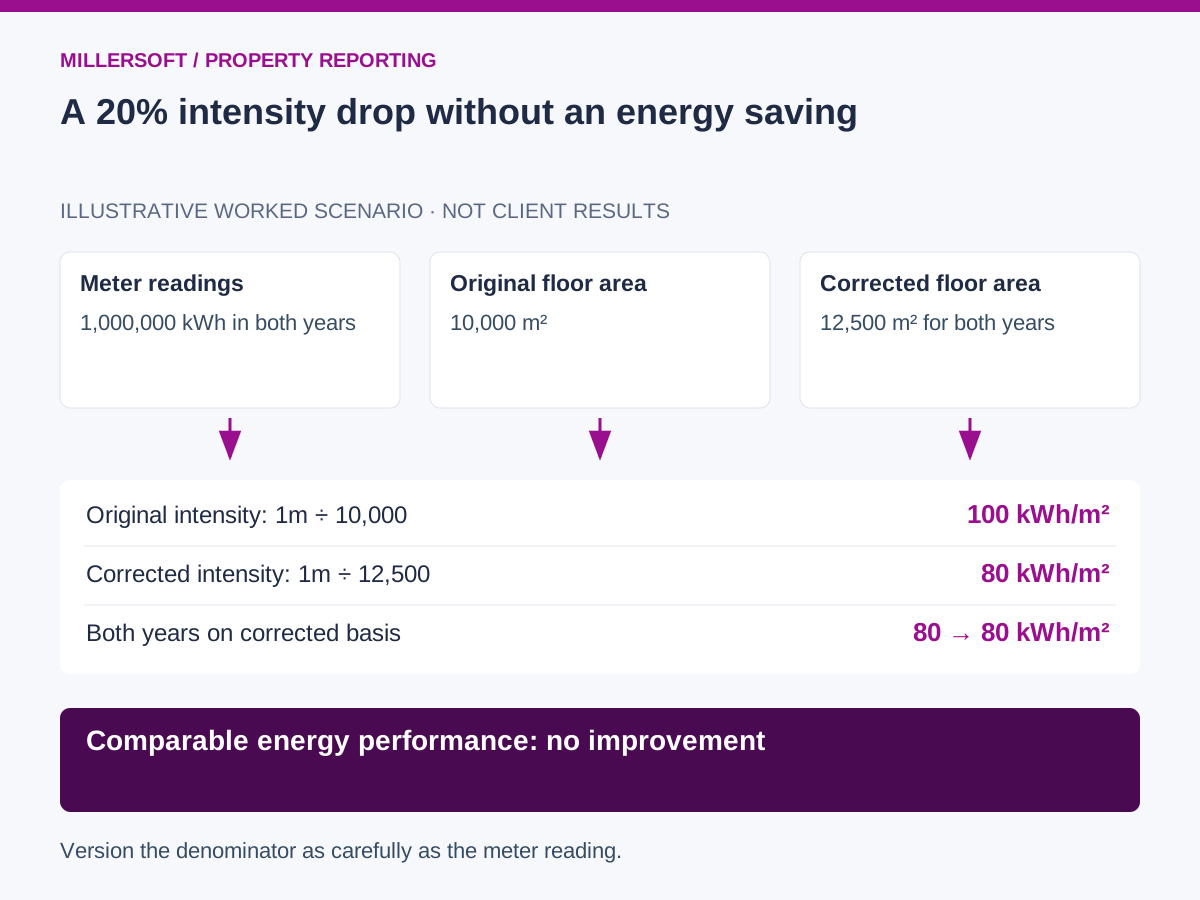
Imagine an illustrative office building consuming 1,000,000 kWh in each of two years. The first report used a floor area of 10,000 square metres. A later review identifies the correct reporting area as 12,500 square metres for both years.
| Calculation | Energy | Area | Intensity |
|---|---|---|---|
| Originally reported first year | 1,000,000 kWh | 10,000 m² | 100 kWh/m² |
| Second year using corrected area | 1,000,000 kWh | 12,500 m² | 80 kWh/m² |
| First year on the same corrected basis | 1,000,000 kWh | 12,500 m² | 80 kWh/m² |
Comparing the first two rows suggests a 20% reduction in intensity. Comparing the last two rows shows no consumption or intensity improvement on a consistent basis. The change came from the denominator, not an energy-saving intervention.
The original report should remain identifiable, while any approved comparable or revised view records the area correction and its supporting evidence.
 (opens the full-size image in a new tab)
Model environmental facts with their measurement context
Link meters to buildings using effective dates. Record whether readings are actual, estimated, allocated or missing, and preserve original units before converting them to a standard unit. Detect duplicate invoices, overlapping meter periods and unexplained gaps.
Version floor-area measurements with the area definition and the building zones included. A whole-building area should not be used automatically for a landlord-only energy numerator. Keep ownership, operational control and reporting-perimeter rules explicit.
For emissions calculations, retain the activity data, factor source, factor year, geography, units and calculation method. Where relevant, distinguish location-based and market-based electricity calculations and the evidence used for each. Do not substitute a new factor into an old published figure without recording the change.
Build a useful first ESG reporting dataset
- Select a small property set and two complete comparison periods.
- Reconcile building identifiers across property records, meters and invoices.
- Validate consumption completeness, unit conversions and reporting boundaries.
- Approve floor-area definitions and emissions calculation assumptions.
- Produce absolute and comparable views with coverage and data-quality indicators.
A good pilot explains both performance and uncertainty. Show the proportion of measured versus estimated consumption, missing meter coverage and the effect of acquisitions or disposals on portfolio totals.
Useful outputs include a property energy-intensity schedule, a meter-completeness report and a movement bridge that separates consumption changes from factor, area and boundary changes. Disclosure requirements and assurance scope still need review against the organisation's applicable framework.
Frequently asked questions
Can finance property IDs be used directly for every meter?
Sometimes, but shared supplies and multi-building meters require a reviewed allocation model. Preserve those relationships and any allocation assumptions.
Does storing ESG data in a warehouse make it assured?
No. A warehouse can preserve evidence and reproducible calculations. Assurance depends on the agreed scope, controls and the work of the appointed assurance provider.
Continue exploring Yardi™ reporting
Back to the Yardi™ data warehouse overview.
- Yardi™ property ledger to fund accounts: reconciliation explained
- Yardi™ audit trails and restatements: reproduce reported figures
Make your property reporting explainable
Talk to Millersoft about a focused Data Vault Engine & Studio pilot using your property data, reporting definitions and control requirements.
Discuss your reporting challengeYardi™ is a trademark of Yardi™ Systems, Inc. Millersoft is not affiliated with Yardi™ Systems, Inc.